
Introduction
In the age of big data, understanding relationships between variables is crucial. Regression analysis is a powerful statistical method used to determine the strength and character of the relationship between one dependent variable and one or more independent variables. It is widely applied in data science, economics, marketing, finance, and healthcare to predict outcomes, identify trends, and make informed decisions.
What is Regression Analysis?
Regression analysis is a form of predictive modeling technique that investigates the relationship between a dependent (target) and independent variable(s) (predictor). The goal is to model this relationship so we can use it to predict future observations.
For example: A company might use regression analysis to understand how advertising budget (independent variable) affects sales revenue (dependent variable).
Artificial Intelligence: Definition, Applications, Benefits, and Future (2025 Guide)
Why is Regression Analysis Important?
Regression helps in:
- Predicting trends and future values
- Determining which variables are most impactful
- Identifying patterns and correlations
- Making data-driven business decisions
It is a foundational method in machine learning for supervised learning tasks.
Basic Terminology
| Term | Definition |
|---|---|
| Dependent Variable | The main factor you’re trying to predict or understand (Y-axis) |
| Independent Variable | Factors that influence the dependent variable (X-axis) |
| Regression Line | A straight or curved line that best fits the data points in the model |
| Coefficient | Numeric value that represents the strength of the relationship |
| R-squared (R²) | Indicates the goodness of fit of the model (ranges between 0 and 1) |
Types of Regression Analysis
Let’s explore the most commonly used types of regression:
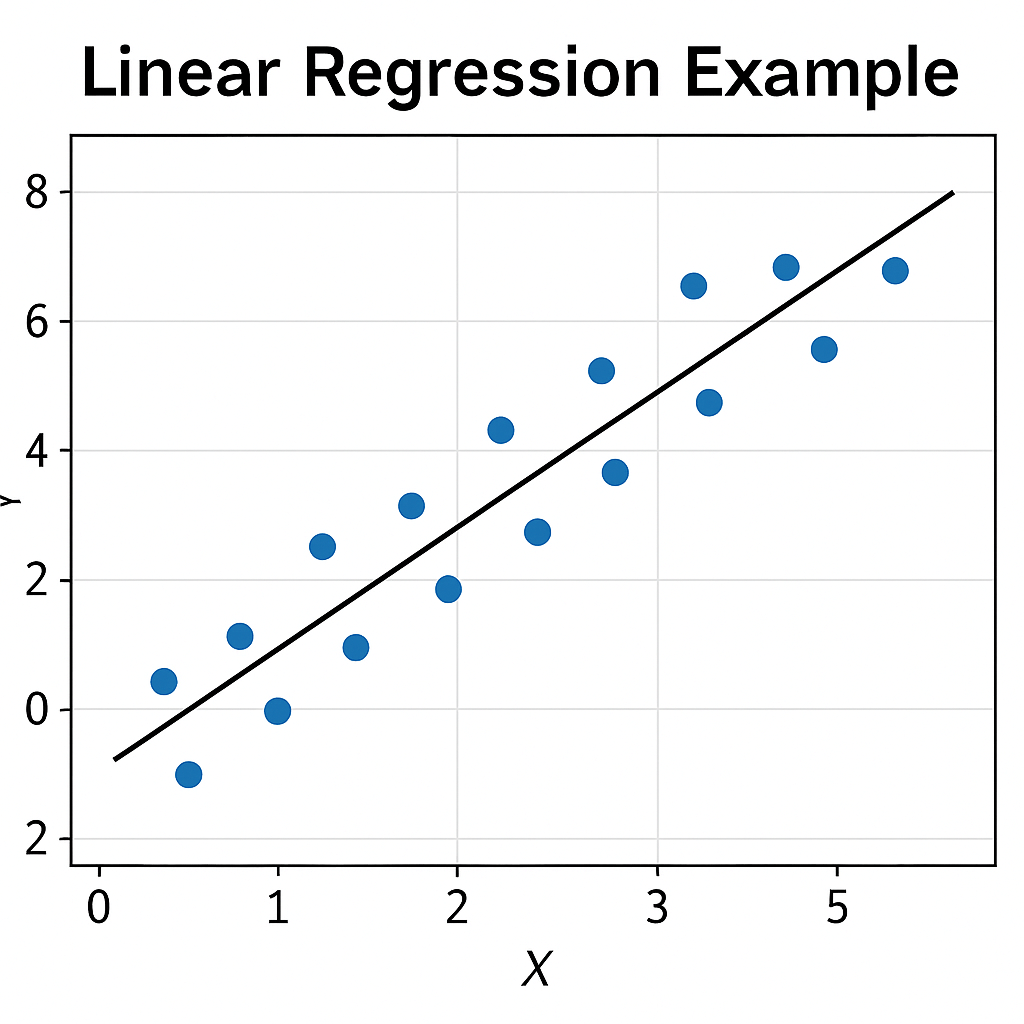
1. Linear Regression
Linear regression establishes a linear relationship between the dependent and independent variables.
Equation:
Y = a + bX + e
Where:
-
- Y = Dependent variable
- X = Independent variable
- a = Intercept
- b = Slope
- e = Error term
Example: Predicting house price based on area.
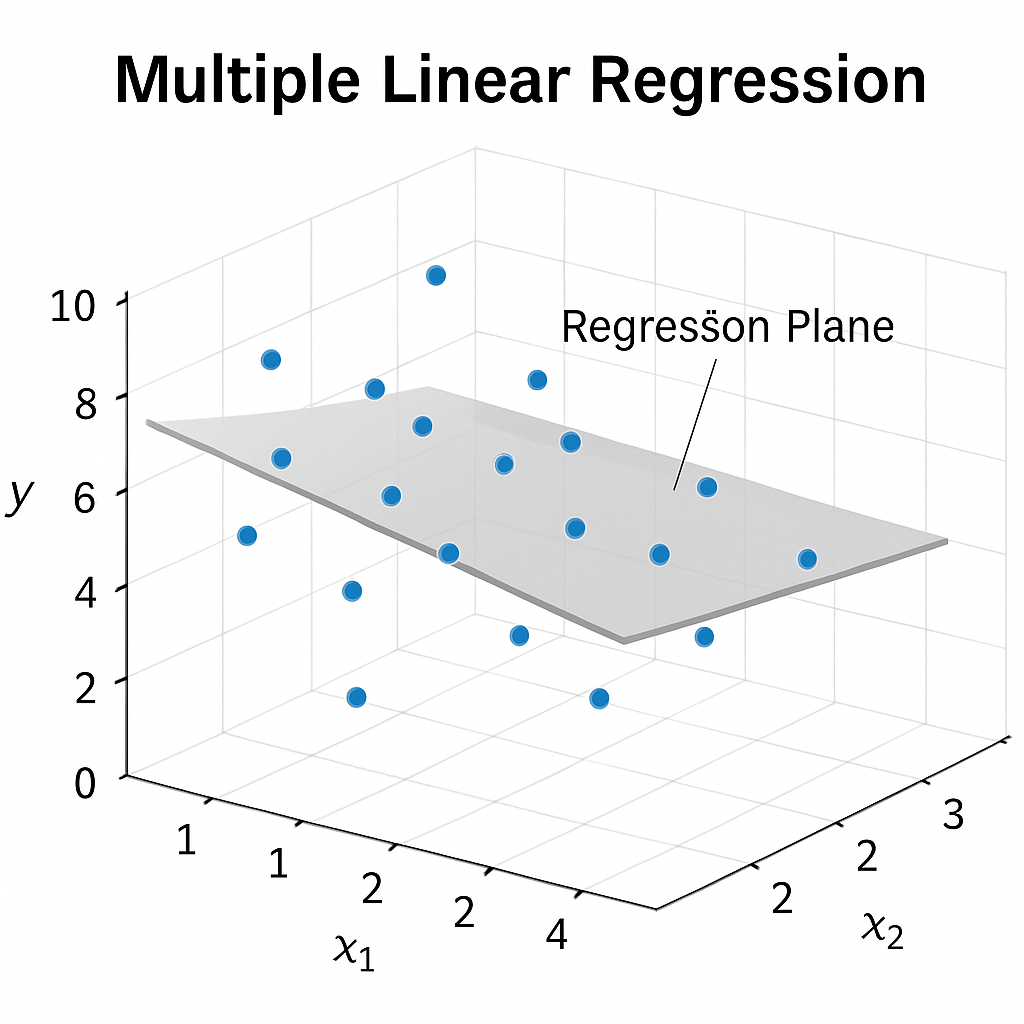
2. Multiple Linear Regression
This involves two or more independent variables to predict the dependent variable.
Equation:
Y = a + b1X1 + b2X2 +......+ bnXn + e
Example: Predicting car price based on age, mileage, and brand.
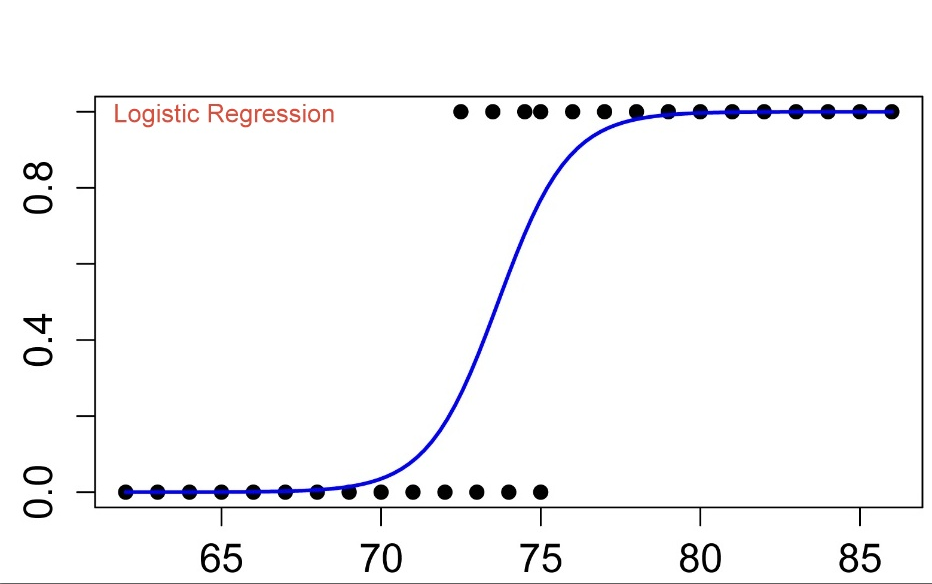
3. Logistic Regression
Despite the name, logistic regression is used when the dependent variable is categorical, not continuous.
Use Case:
- Spam or not spam
- Will a customer churn or not
- Disease present or not
It uses the sigmoid function to map predicted values between 0 and 1.
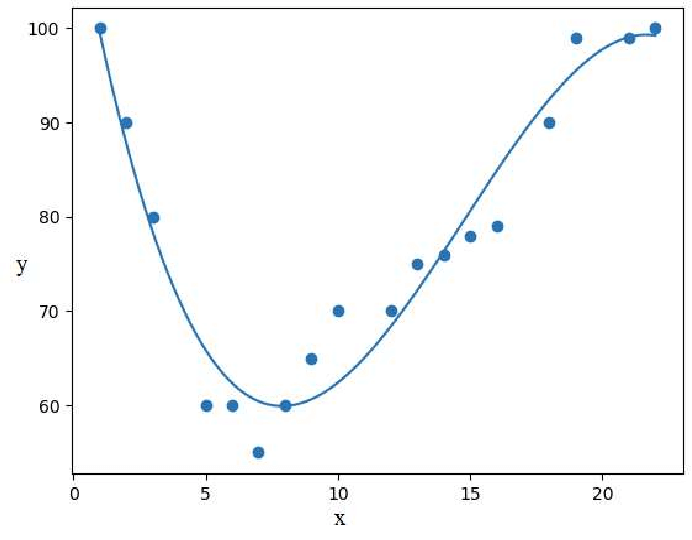
4. Polynomial Regression
It fits a non-linear relationship between independent and dependent variables.
Equation:
Y = a + bX + bX2 + bX3 +......
Example: Predicting sales growth which follows an exponential trend.
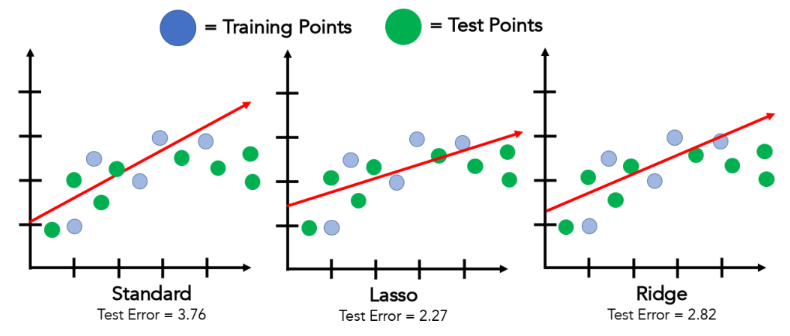
5. Ridge and Lasso Regression
Used when the model faces multicollinearity or overfitting.
They apply penalty terms to shrink less significant variables.
- Ridge Regression adds L2 penalty
- Lasso Regression adds L1 penalty (also helps in feature selection)
Real-World Applications
| Industry | Use Case Example |
|---|---|
| Finance | Predicting stock prices, credit risk modeling |
| Marketing | Analyzing campaign effectiveness, customer segmentation |
| Healthcare | Predicting disease outbreak, drug efficacy |
| Retail | Sales forecasting, inventory optimization |
| Economics | Estimating GDP impact factors |
Regression in Machine Learning
In machine learning, regression is a core supervised learning algorithm. It is used to:
- Train models to predict numeric values
- Improve decision-making accuracy
- Evaluate feature importance
Popular regression algorithms include:
- Linear Regression
- Decision Tree Regressor
- Random Forest Regressor
- Support Vector Regressor
- Neural Network Regressor
Advantages of Regression Analysis
- Easy to implement and interpret
- Quantifies the strength of relationships
- Predicts trends accurately with large datasets
- Scalable for simple and complex models
Limitations
- Assumes a linear relationship (in simple linear regression)
- Sensitive to outliers
- Multicollinearity affects coefficient stability
- Overfitting possible with too many predictors
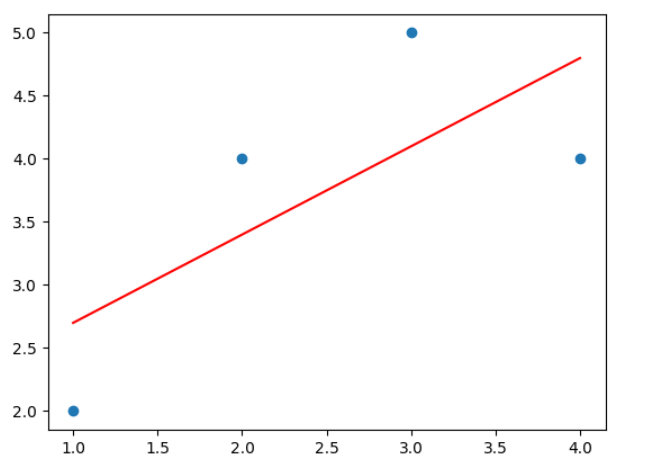
Example: Simple Linear Regression in Python
from sklearn.linear_model import LinearRegression
import numpy as np

# Sample data
X = np.array([[1], [2], [3], [4]])
y = np.array([2, 4, 5, 4])

# Create model
model = LinearRegression()
model.fit(X, y)

# Prediction
print(model.predict([[5]])) # Output: [approximate value]
Interpreting Results
- High R² (> 0.8) → Good model fit
- Low p-values (< 0.05) → Strong relationship
- Residuals should be normally distributed and show no pattern
Best Practices
- Visualize the data before modeling
- Check for multicollinearity
- Normalize or scale features
- Regularize models to prevent overfitting
- Validate with test data
Industry & Application Examples
1. IBM – Regression in Machine Learning
https://www.ibm.com/cloud/learn/regression-analysis
Explains the types and uses of regression in machine learning contexts.
2. Towards Data Science (Medium)
https://towardsdatascience.com/understanding-regression-analysis-2f70c3b2c4c8
A practical and insightful read on applying regression in real-world data projects.
3. Statology – Regression Tutorials
https://www.statology.org/regression-analysis/
Examples and explanations of different regression types with use cases.
Conclusion
Regression analysis is a critical tool in both traditional statistics and modern machine learning. Whether you’re analyzing market trends or building a predictive model, mastering regression techniques allows you to extract valuable insights from data.
With different types of regression models—linear, logistic, multiple, polynomial, ridge, lasso—you can choose the one best suited to your problem and ensure your predictions are both accurate and reliable.


")


")